The indices, explained
Cost efficiency (CPI), schedule efficiency (SPI and SPI(t)), estimate at completion and to-complete performance, each with the formula it used.
Cost and earned value
Actual costs come in by entry or spreadsheet. Earned value, earned schedule and the forecast cost move with every update, in your workspace's currency.
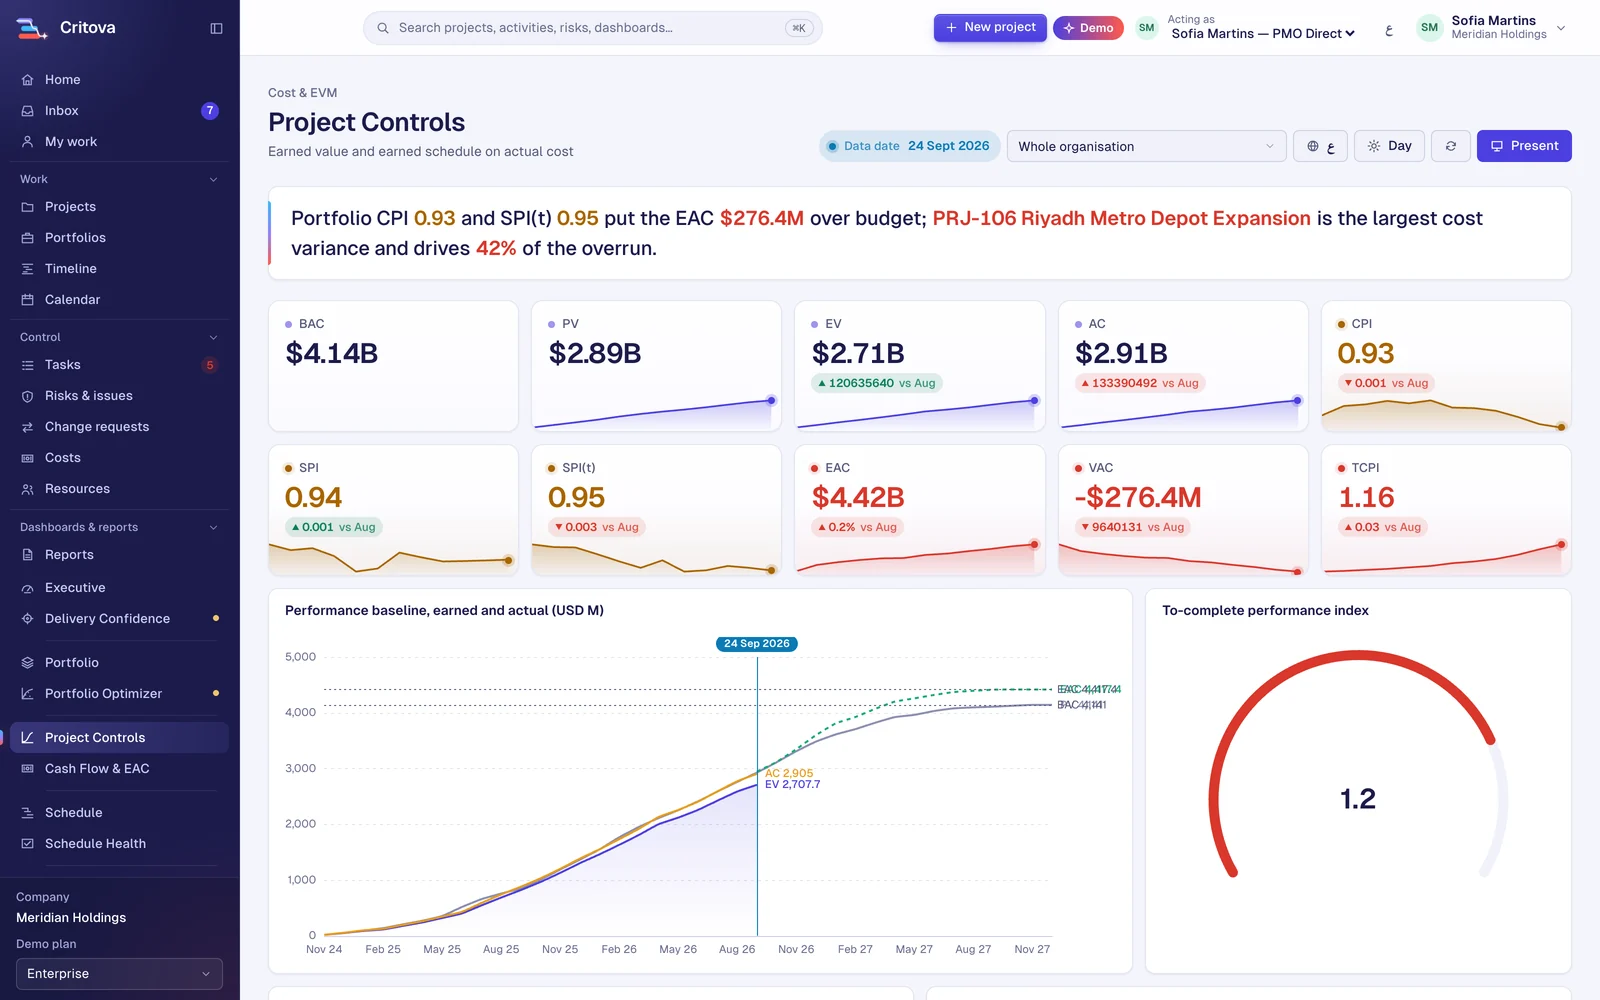
Cost efficiency (CPI), schedule efficiency (SPI and SPI(t)), estimate at completion and to-complete performance, each with the formula it used.
Cost entries by activity, category and vendor, typed in or taken from a spreadsheet. ERP connectors are planned.
SPI(t) keeps telling the truth late in a project, when classic SPI drifts back to 1.
Monthly spend against plan across the portfolio, the forecast cost drift and the months that need funding.
An approved change adds its cost to the budget and its days to the committed date, with an audit trail.
Aligned with ANSI/EIA-748 practice as a self-assessment. We print methods, not badges.
No. Enter costs or upload a spreadsheet; that works with any ERP. Direct connectors are on the roadmap.
Any currency. Each workspace chooses its own project currency, and every figure follows it.
Free during our launch until 31 March 2027.