Everything a PMO runs on, in one place
Schedules, costs, risks, changes, people and the dashboards that read them. The same numbers from the site team to the steering committee.
Projects and portfolios
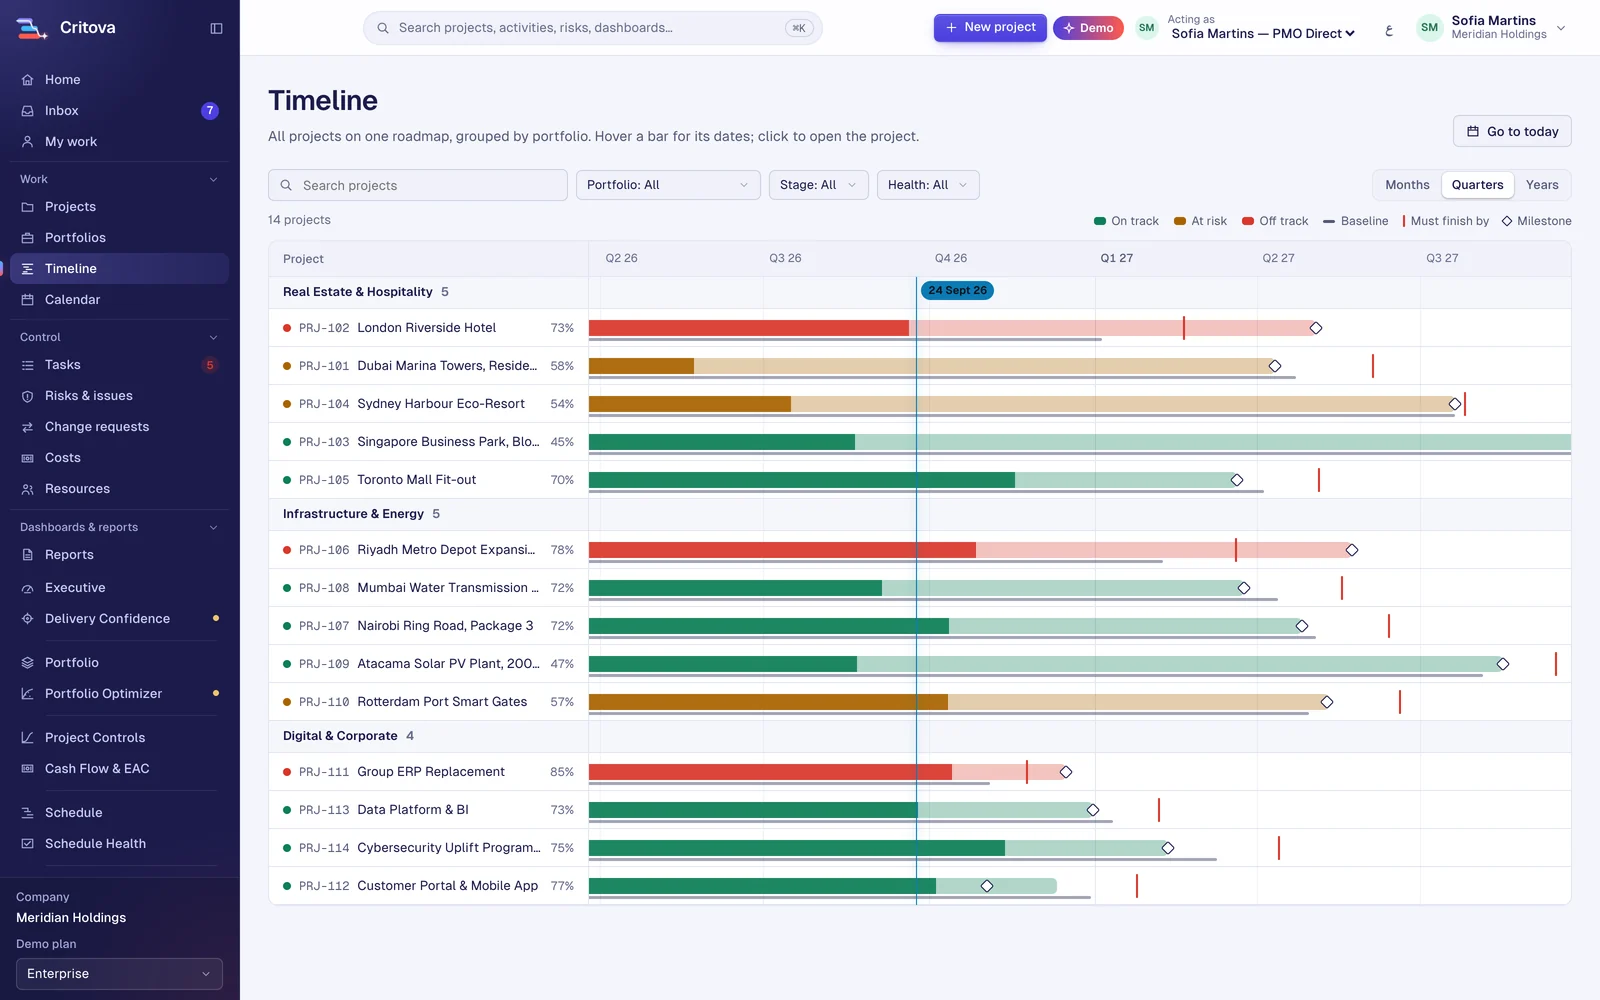
Every project in a list, a board by stage or cards. Group by portfolio, filter by health or manager, and open any project in one click. Portfolios roll up budget, forecast cost and health.
- New-project wizard with templates for buildings, infrastructure and digital work
- Timeline of every project with milestones and the must-finish date
Schedule
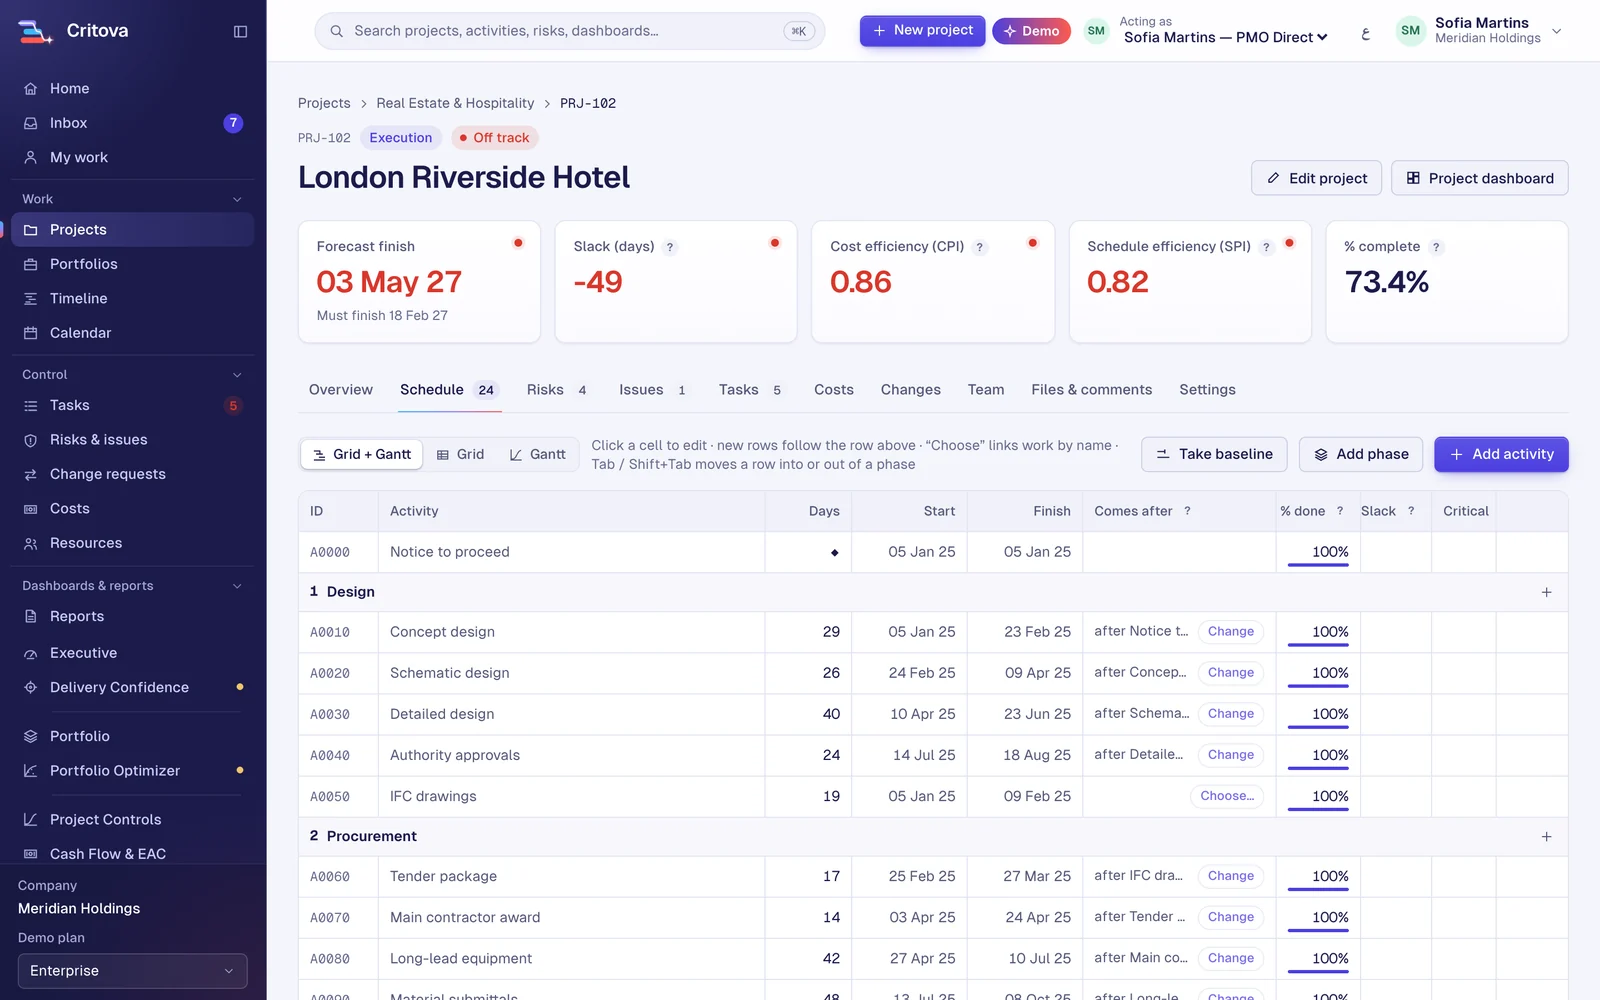
A spreadsheet-like activity grid above a Gantt chart. New rows follow the row above, links are chosen by name, and phases indent and outdent. Critova reschedules as you type.
- Finish-to-start, start-to-start, finish-to-finish and start-to-finish links with lags
- Constraints, milestones, level-of-effort and working calendars with holidays
- Baselines, variance and the data-date line
Costs and earned value
Record actual costs by activity, category and vendor. Earned value and earned schedule update with every entry, and the forecast cost tells you where the project will land.
- Planned value from the baseline, earned value from progress
- S-curves, the EAC family and TCPI with plain-language labels
Risks, issues and Monte Carlo
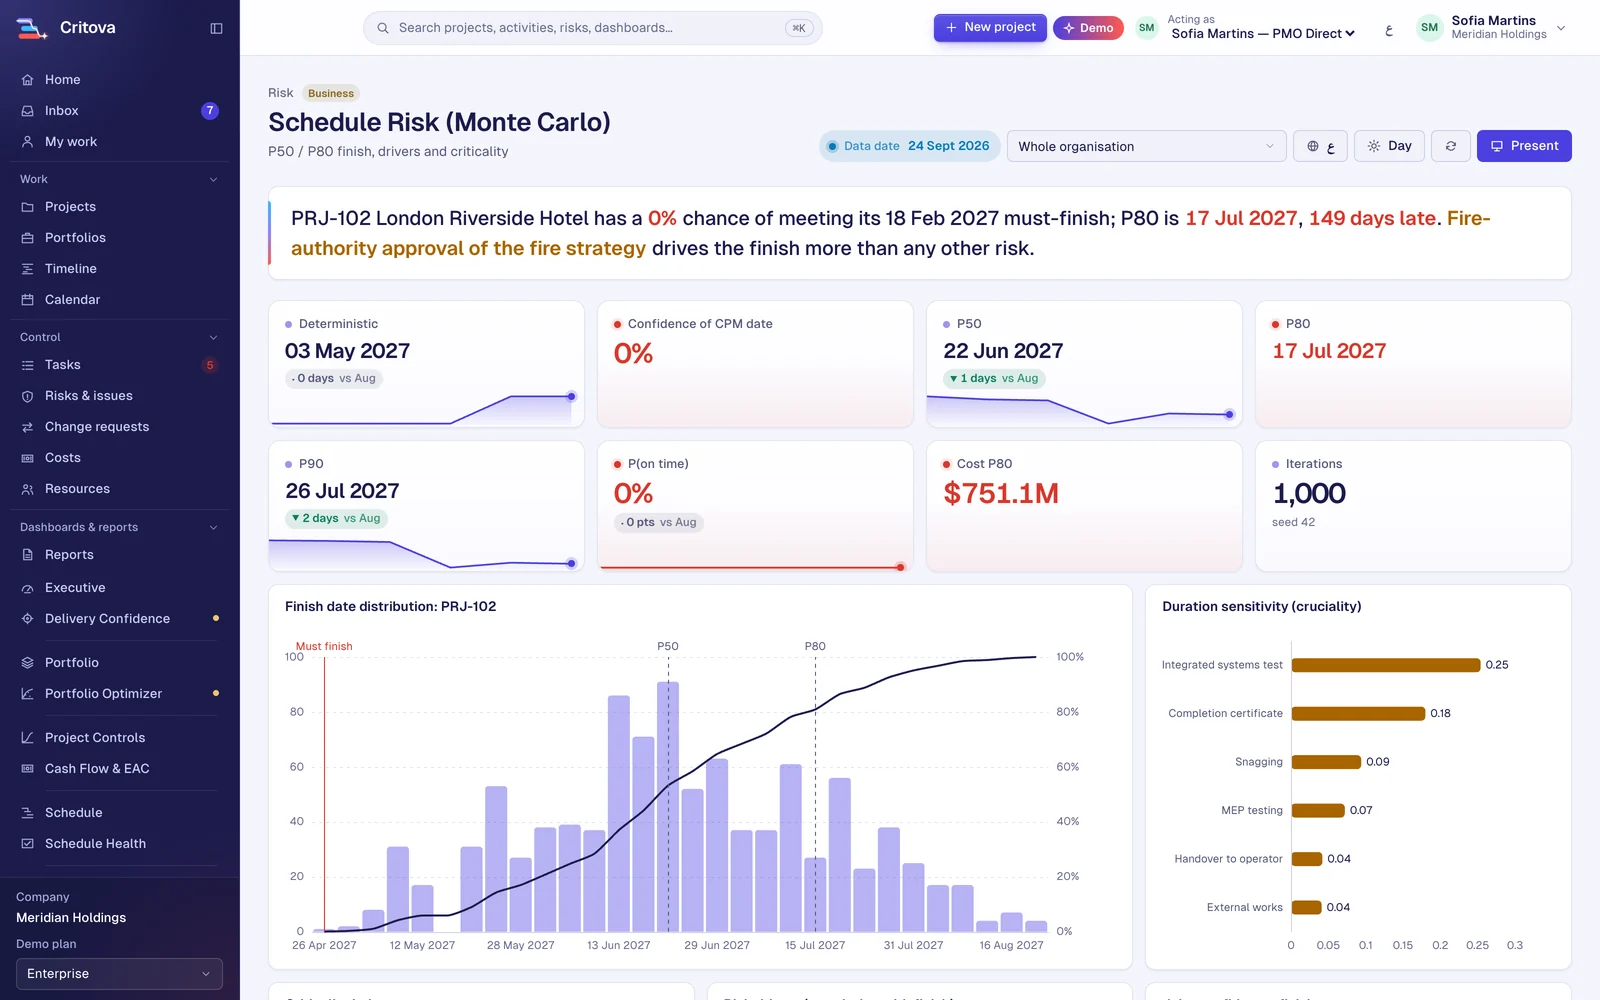
A risk register with a five by five matrix, owners, responses and due dates, plus an issue log. Link risks to activities and run a Monte Carlo on the schedule to see P50, P80 and P90 finish dates.
- Threats and opportunities with expected monetary value
- Tornado of drivers and criticality index per activity
Change control
Raise a change request with its impact in days and money, submit it, and approve or reject with a note. Approval moves the budget and the committed date, and everything is recorded.
- Draft, submitted, approved or rejected, implemented
Resources and workload
Invite people, give them access, assign them to activities and see who is over-loaded week by week before it happens.
- Workload heatmap by person or discipline
Eleven dashboards
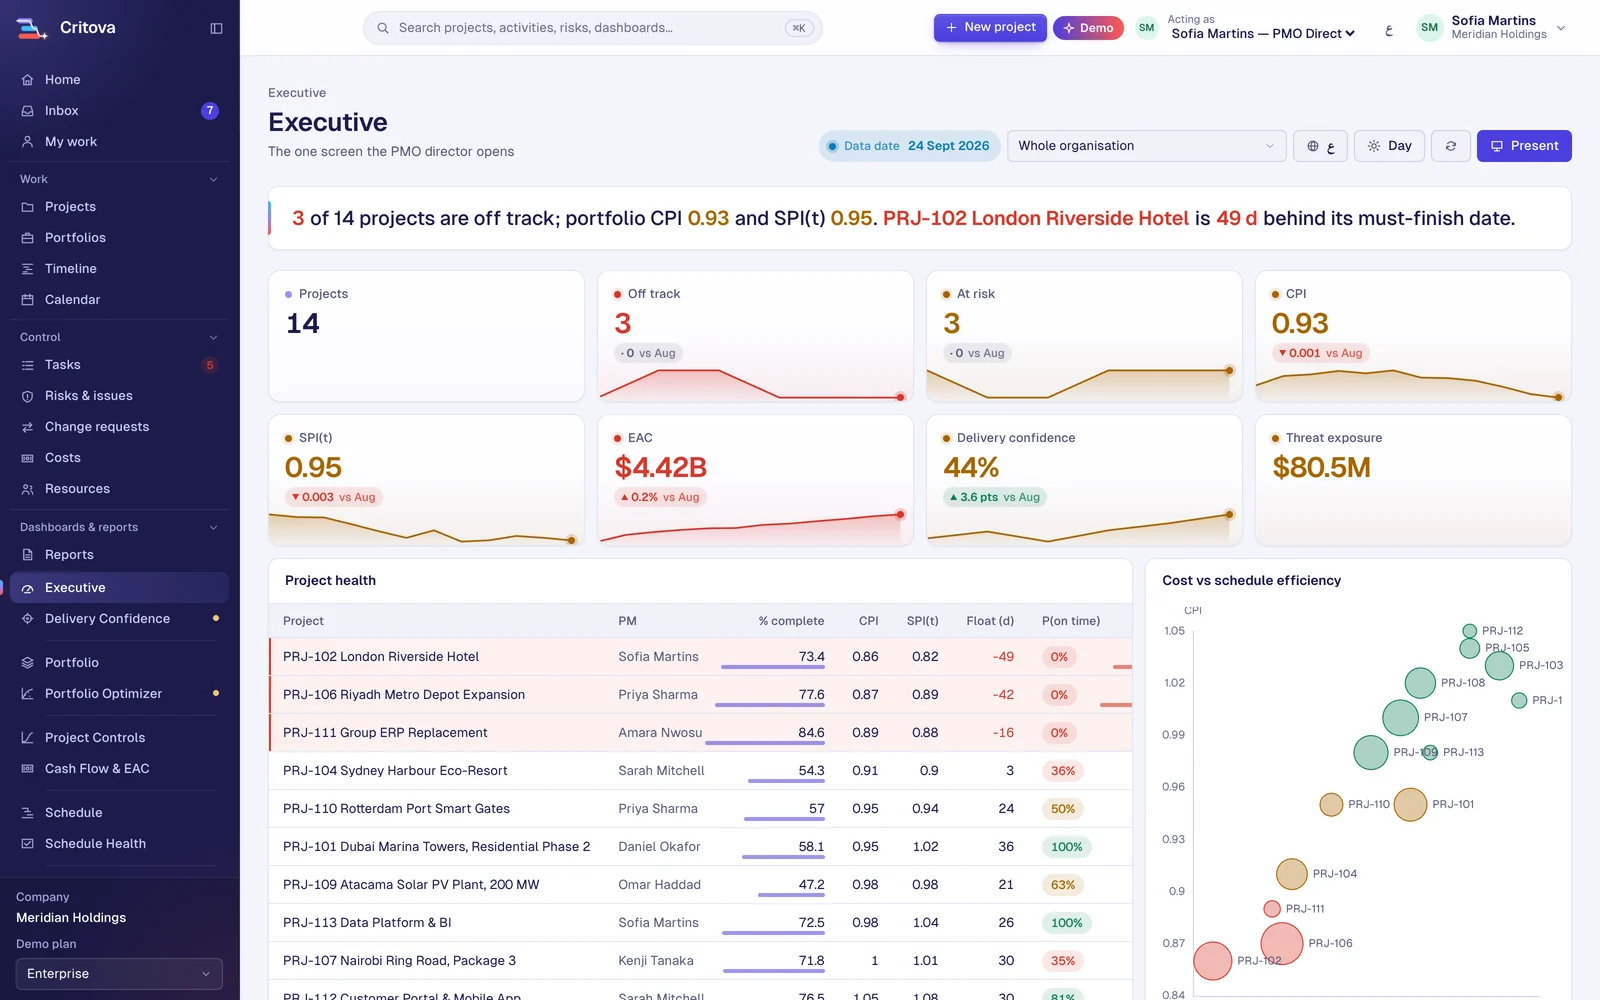
Executive, delivery confidence, portfolio, portfolio optimiser, project controls, cash flow, schedule, schedule health, risk register, Monte Carlo and capacity. Each opens with a sentence that names the worst thing.
- Present mode for steering committees
- Every chart has a data table view
Reports and exports
A printable status report per project in Arabic or English, and Excel exports for projects, activities, risks, issues, tasks, costs and changes.
Import and export
Drop an MS Project XML, Primavera XER, P6 XML, Excel or CSV file. Check the preview and any warnings, then create a new project or replace a schedule.
Global by design
English and Arabic today, with more languages planned and right-to-left screens built in. Each workspace sets its own currency, working week, holidays and time zone, and date axes stay readable in every language.
See it with a complete demo company
The live demo opens Meridian Holdings, a fictional international group: 14 projects in cities around the world across three portfolios, with baselines, progress, costs and risks.